Bayesian statistics: using R
Introduction
Bayesian statistics is a powerful approach to data analysis that updates the probability of a hypothesis as new evidence becomes available.
This document presents an introductory course on Bayesian statistics. This course is designed for beginner and who want to refresh their knowledge on Bayesian statistics.
Bayesian thinking
First, let me ask you some questions:
1. Do you believe that knowledge is always derived from data, or can it also come from belief or prior experience?
- Belief and experience are valid starting points for knowledge.
- Only data should inform conclusions.
2. Is it possible to assign a probability to a one-time event, like the outcome of a specific election or a historical fact?
- Yes
- No
3. Should science be allowed to express uncertainty in terms of belief or should it strive to remain strictly objective?
- Express uncertainty in terms of belief
- Science must be impersonal and detached from belief
4. When making decisions under uncertainty, should we rely only on observed evidence or also on what we previously expected?
- Integrate expectation with evidence
- Observed evidence only
5. Can two rational people look at the same data and come to different conclusions?
- Yes
- No
If you answered mostly “a,” congratulations — you already think like a Bayesian!
Now, let’s understand one very basic concept………………………
Assume, you recently visited a hospital due to a severe headache. After a clinical evaluation, your doctor recommended a blood serology test. Based on the test results, the doctor informed you: “You may be suffering from neurocysticercosis (NCC), a parasitic disease of the human central nervous system caused by the zoonotic tapeworm Taenia solium.” In other words, your test came back positive.
You ask for more information, and the doctor shares the following about the test (let’s call it Test X):
- Name of the test: X
- Sensitivity: 95%
- Specificity: 98%
Now you’re wondering:
“What is the probability that I actually have NCC, given that I tested positive?”
What is “Sensitivity” and “Specificity”?
\[ Probability(Tested Positive | Diseased) = Pr(T+|D+) \] Full equation is (No need to understand at this moment)- \[ \text{Sensitivity} = \frac{\text{True Positives}}{\text{True Positives} + \text{False Negatives}} \]
These properties of a diagnostic test give us one important information that “the Test was NOT flawless” |
For our imaginary scenario,
we have
Sensitivity of the test= Pr(T+|NCC+) = 0.95
Specificity of the test = Pr(T-|NCC-) = 0.98
Assume, from a recent study we have known that among people with headache (PWH) the NCC is about 14%. In other word, the prevalence of NCC among PWH is 14%.
Pr(NCC+|Headache+) = 0.14
Now, you want to know, Pr(NCC+|T+ & Headache+) = ?
For simplicity we will omit “Headache+” part. So,
Pr(NCC+) = 0.14
Pr(NCC+|T+) = ? (look, this is exactly opposite of the notation used for “Sensitivity”)
Of note, if A and B two independent events :
\[ Pr(A \mid B) \ne Pr(B \mid A) \]
Now, from probability we know that -
\[ \Pr(\text{NCC+} \mid T+) = \frac{\Pr(\text{NCC+} \cap T+)}{\Pr(T+)} \]
Here, \(\Pr(\text{NCC+} \cap T+)\)also called as probability of “True positive”. and
\(\Pr(T+)\) is called probability of “Positive”. This include both True positive and False positive probability.
Let’s make a tree-diagram with given information:
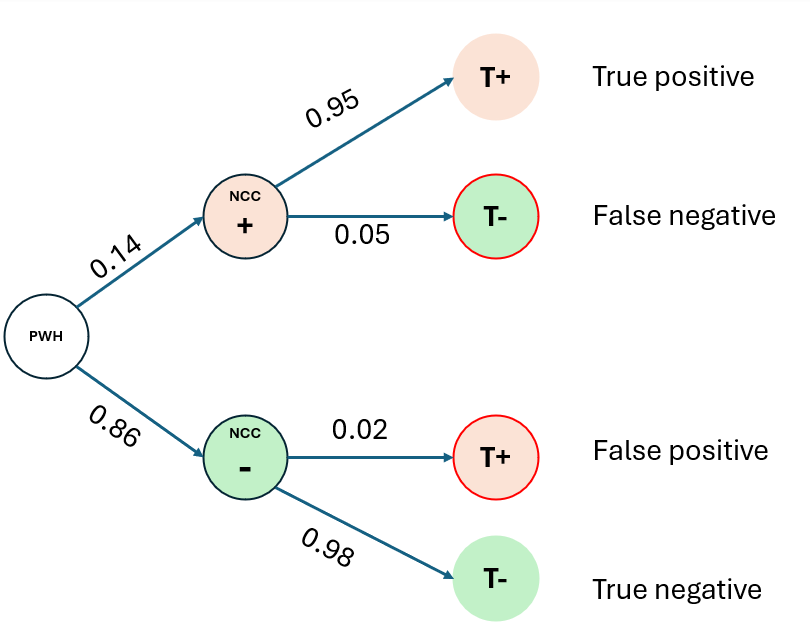
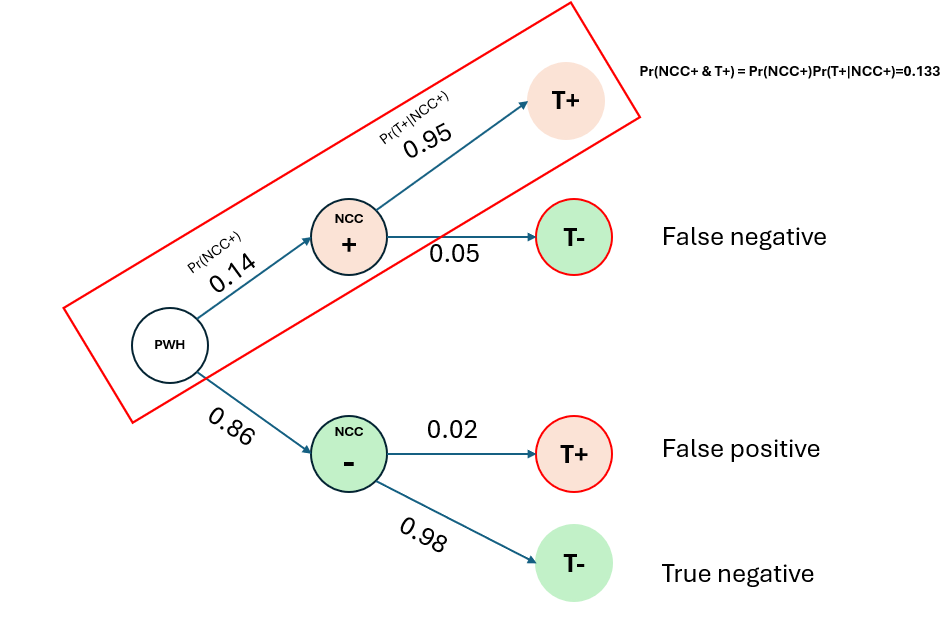
From the tree-diagram,
Pr(True NCC+) = Pr(NCC+ & T+) = Pr(NCC+).Pr(T+|NCC+) = 0.14*0.95 = 0.133 = 13.3%
Similarly,
Pr(False NCC-) = Pr(NCC+ & T-) = Pr(NCC+).Pr(T-|NCC+) = 0.14*0.05 = 0.007 = 0.7%
Pr(False NCC+) = Pr(NCC- & T+) = Pr(NCC-).Pr(T+|NCC-) = 0.86*0.02 = 0.017 = 1.7%
Pr(True NCC-) = Pr(NCC- & T-) = Pr(NCC-).Pr(T-|NCC-) = 0.86*0.98 = 0.843 = 84.3%
So, probability of tested positive,
Pr(T+) = Pr(True NCC+) + Pr(False NCC+) = 0.133 + 0.017 = 0.15 = 15%
So,
\[ \text{Pr(NCC+|T+)} = \frac{\text{0.133}}{\text{0.15}}= \text{0.887} = \text{88.7%}\]
In conclusion, you have about 89% chance to have NCC given that the test was positive.
If we understand the calculation given above, It will be very easy for us to understand the Bayes’ Theorem. We actually already applied this theorem.
Bayes’ Theorem
The foundation of Bayesian statistics is Bayes’ Theorem, which describes how to update probabilities based on new evidence. It say’s that -
“The conditional probability of an event A given that event B has occurred is equal to the product of the probability of B given A and the probability of A, divided by the probability of event B”
The theorem is expressed as:
\[ P(A \mid B) = \frac{P(B \mid A) \cdot P(A)}{P(B)} \]
Where:
- P(A |B) = probability of observing A given that B has already occurred (Posterior probability)
- P(B |A) = Probability of observing B if A is true (Likelihood)
- P(A) = Probability of observing A, before knowing anything about B (Prior probability)
- P(B) = Probability of observing B (Marginal probability).
If we write the Bayes theorem for our previous example it will be -
\[ P(NCC+ \mid T+) = \frac{P(T+ \mid NCC+) \cdot P(NCC+)}{P(T+)} \]
Let’s think the theorem in another way ………………………….
- Why doctor suggested the specific test for NCC? - Because, he thought you might have NCC. He know that you will have tested positive or negative based on the actual cause of your headache. This thinking is called “hypothesis” . “A hypothesis is an educated guess or proposed explanation that can be tested through observation, experimentation, or analysis.”
- Why doctor thought you might have NCC? - Because, your clinical manifestation was severe headache. And doctor know that about 14% people with headache can be due to NCC. This is the “prior”.
- What can do the test? - The test can identify the “positive” and “negative” cases of NCC.
- What was the test results? - The results of the test was “positive”. So, this is the “Observed data”.
- What doctor wanted to know? - He want to strengthen the belief he had before testing you. After getting the test results doctor concluded, you might have NCC.
- What you want to know? - You make a new hypothesis that ” you might or might not have NCC”. Then, observing data “positive test” results, you want to calculate the probability of actually having NCC. You also know that about 14% people with headache can be due to NCC. This is your “prior”.
In a nutshell, we can say that “Having or not-having NCC” is our hypothesis, and test results is our data. Now, we can re-write our equation as follows -
\[ P(Hypothesis\mid Data) = \frac{P(Data\mid Hypothesis) \cdot P(Hypothesis)}{P(Data)} \]
That make sense?
Are you now ready to learn more about Bayesian statistics? If, yes, let’s move to the next section.
Now, we will learn how to determine the prevalence of a disease using Bayesian model. More, specifically, Bayesian binomial model. To learn about Bayesian binomial model, click here